
Key performance indicators (KPIs) are crucial for online stores. They help track success and guide growth strategies.
Running an online store is not just about having products available for sale. It’s also about understanding how well your store performs. KPIs are specific metrics that show how your online store is doing. They offer insights into various aspects of your business, from sales numbers to customer satisfaction.
By keeping an eye on these indicators, you can make better decisions and improve your store’s performance. This blog post will explore the essential KPIs for online stores and how they can help you achieve your business goals. Get ready to learn about the metrics that matter most for your online success.

Credit: www.shopify.com
Introduction To Kpis
Key Performance Indicators (KPIs) are essential tools for any online store. They help measure success and guide business decisions. KPIs provide valuable insights into different aspects of your online business. Tracking these indicators ensures you stay on the right path to achieve your goals.
Importance Of Kpis
KPIs are crucial because they offer a clear view of your store’s performance. They help identify strengths and weaknesses. With this information, you can make informed decisions. KPIs also help in setting realistic goals for your business. They keep your team focused on what matters most. By monitoring KPIs, you can quickly spot trends and make adjustments.
How Kpis Drive Sales
KPIs play a key role in driving sales for your online store. They highlight which products are performing well. This allows you to focus on promoting popular items. KPIs also reveal customer behavior patterns. Understanding these patterns helps improve marketing strategies. You can tailor your efforts to meet customer needs. KPIs also help track the effectiveness of promotions and discounts. By analyzing this data, you can optimize your sales tactics.
Traffic And Engagement Metrics
When running an online store, understanding how users interact with your website is crucial. Traffic and engagement metrics are essential in helping you gauge the effectiveness of your marketing strategies and overall user experience. These metrics provide insights into how many people visit your site, how they navigate through it, and how long they stay. Let’s dive deeper into some key performance indicators (KPIs) under the umbrella of traffic and engagement metrics.
Website Visitors
One of the most fundamental metrics to track is the number of website visitors. This metric tells you how many people are coming to your site within a specific timeframe. It’s like counting the number of people entering a physical store. But, how can you use this data effectively?
- Trend Analysis: Check if the number of visitors is growing over time. A steady increase usually means your marketing efforts are paying off.
- Traffic Sources: Identify where your visitors are coming from. Are they finding you through search engines, social media, or direct visits? This can help you optimize your marketing channels.
- New vs. Returning Visitors: Measure the ratio of new visitors to returning ones. A good balance is necessary, as new visitors mean you’re expanding your reach, while returning visitors often indicate loyalty.
Page Views And Session Duration
Page views and session duration are like the bread and butter of engagement metrics. They tell you not just how many people are visiting your site, but also what they are doing once they get there.
Let’s break it down:
- Page Views: This metric shows how many pages a visitor views during a single session. More page views often indicate higher engagement.
- Session Duration: This measures the length of time a visitor spends on your site in a single session. Longer sessions typically mean users find your content valuable and engaging.
Here’s how you can leverage these metrics:
- Identify Popular Pages: See which pages get the most views. This helps you understand what content resonates with your audience.
- Improve User Experience: If session durations are short, it might indicate users are not finding what they need quickly enough. Consider revisiting your site’s layout and navigation.
- Test and Optimize: Use A/B testing to try different page designs or content formats to see which keeps users engaged longer.
So, next time you check your analytics, pay close attention to these metrics. They are more than just numbers; they are windows into the minds of your visitors, telling you what works and what doesn’t. Happy analyzing!
Conversion Rate Indicators
Understanding the conversion rate indicators is crucial for any online store. These indicators help measure the effectiveness of your sales funnel. By monitoring these, you can identify areas for improvement. Two important metrics are the cart abandonment rate and the checkout conversion rate.
Cart Abandonment Rate
The cart abandonment rate shows the percentage of shoppers who add items to their cart but do not complete the purchase. High rates may indicate issues with the checkout process. Common reasons include unexpected shipping costs, long checkout processes, and lack of trust.
To reduce this rate, simplify the checkout process. Offer clear shipping information and ensure the website is secure. Providing multiple payment options can also help. A low cart abandonment rate means more completed sales.
Checkout Conversion Rate
The checkout conversion rate measures the percentage of shoppers who complete their purchase after starting the checkout process. This metric is crucial for understanding the effectiveness of your checkout page. A low rate may signal problems that discourage final purchases.
Enhance the checkout experience to improve this rate. Ensure the process is quick and easy. Display trust signals, like security badges, and offer guest checkout options. An optimized checkout can lead to higher sales.
Customer Acquisition Metrics
Customer acquisition metrics are crucial for online stores. They help track how effectively your business attracts new customers. Understanding these metrics can lead to better marketing strategies and improved sales.
Cost Per Acquisition
Cost Per Acquisition (CPA) measures the cost of gaining one new customer. It includes expenses like marketing, advertising, and promotions. Lowering CPA means more customers for less money. To calculate CPA, divide total marketing costs by the number of new customers. Tracking CPA helps identify the best marketing channels.
Customer Acquisition Channels
Customer Acquisition Channels show where new customers come from. Examples include social media, search engines, email marketing, and paid ads. Knowing which channels work best helps allocate your budget wisely. Analyze each channel to see which one brings the most customers at the lowest cost. Focus on the most effective channels to boost your sales.
Customer Retention Metrics
When running an online store, keeping customers coming back is key. This is where customer retention metrics come into play. They help you understand how well you are maintaining relationships with your customers. Let’s dive into two crucial metrics: Repeat Purchase Rate and Customer Lifetime Value.
Repeat Purchase Rate
Ever wonder how many of your customers come back for more? The Repeat Purchase Rate (RPR) tells you just that. It’s a simple metric but incredibly powerful.
- Why it matters: Higher RPR means your customers love what you sell. It also costs less to keep an existing customer than to get a new one.
- How to calculate: RPR = (Number of Returning Customers / Total Number of Customers) x 100
For example, if 30 out of 100 customers made another purchase, your RPR is 30%. Simple, right?
Pro tip: Keep an eye on this metric monthly. If you see a drop, it might be time to re-evaluate your customer service or product range.
Customer Lifetime Value
Now, let’s talk money. The Customer Lifetime Value (CLV) tells you how much a customer is worth over their entire relationship with your store. It’s like seeing the big picture of your business.
- Why it matters: Knowing your CLV helps you decide how much to spend on acquiring new customers. It also highlights the importance of retaining customers.
- How to calculate: CLV = Average Order Value x Purchase Frequency x Customer Lifespan
For instance, if customers typically spend $50 per order, buy twice a year, and stay loyal for 5 years, your CLV is $500. Not too shabby, right?
Think of CLV as your business’s health indicator. The higher it is, the better your business is doing.
In conclusion, understanding these metrics can transform your business strategy. They are like the heartbeat of your online store, ensuring you’re not just attracting customers but also keeping them happy and engaged. So, start tracking and watch your business thrive!
Sales Performance Metrics
Sales performance metrics are essential for assessing the success of your online store. They help you understand how well your business is performing. These metrics provide insights into revenue, costs, and profitability. Understanding these metrics allows you to make informed decisions. Two critical sales performance metrics include Average Order Value and Gross Margin.
Average Order Value
Average Order Value (AOV) shows the average amount spent each time a customer places an order. It is calculated by dividing total revenue by the number of orders. A higher AOV indicates customers are spending more per transaction. This metric can help you identify opportunities to increase revenue. Consider offering product bundles or discounts on larger purchases. These strategies can encourage customers to spend more per visit.
Gross Margin
Gross Margin is the difference between sales revenue and the cost of goods sold (COGS). It is expressed as a percentage of sales revenue. A higher gross margin means your business retains more profit after covering the costs. This metric helps you understand your profitability. To improve gross margin, consider reducing production costs or increasing product prices. It is crucial to maintain a balance between cost and quality. This ensures customer satisfaction while maximizing profits.
Inventory Management Metrics
Inventory management metrics are crucial for online stores. They help in tracking stock levels, understanding sales patterns, and ensuring customer satisfaction. Effective inventory management leads to better decision-making and optimized operations.
Stock Turnover Rate
Stock turnover rate measures how often you sell and replace inventory. A high turnover rate indicates strong sales and efficient inventory management. A low rate may suggest overstocking or weak sales. Calculate stock turnover by dividing the cost of goods sold by average inventory. This metric helps in identifying popular products and managing stock levels.
Backorder Rate
Backorder rate tracks the percentage of orders that cannot be fulfilled at the time of purchase. A high backorder rate can frustrate customers and harm your reputation. Calculate backorder rate by dividing the number of backorders by total orders placed. Monitoring this metric helps in improving inventory planning and ensuring product availability.

Credit: www.mavensolutions.tech
Customer Satisfaction Metrics
In the bustling world of online stores, keeping customers happy is key. Customer satisfaction metrics help you understand how well you are meeting your customers’ needs. By measuring these metrics, you can spot areas for improvement and make changes that boost customer loyalty. Let’s dive into some crucial metrics that every online store owner should keep an eye on.
Net Promoter Score
The Net Promoter Score (NPS) is a simple yet powerful tool to gauge customer loyalty. It asks one straightforward question: “On a scale of 0-10, how likely are you to recommend our store to a friend or colleague?” Based on the responses, customers are categorized into:
- Promoters (9-10): Loyal customers who will keep buying and refer others.
- Passives (7-8): Satisfied but unenthusiastic customers who are vulnerable to competitive offers.
- Detractors (0-6): Unhappy customers who can damage your brand through negative word-of-mouth.
To calculate your NPS, subtract the percentage of Detractors from the percentage of Promoters. The result can range from -100 to 100. A high score indicates strong customer loyalty, while a low score suggests there’s room for improvement.
Customer Reviews And Ratings
Customer reviews and ratings are essential for understanding how customers feel about your products and services. They provide valuable insights into what you’re doing right and where you need to improve. Positive reviews can boost your credibility and attract new customers, while negative reviews offer a chance to address issues and improve.
Consider setting up a system to regularly collect and analyze reviews. This can be done through:
- Email follow-ups after a purchase.
- Incentives for leaving feedback.
- Integrating review widgets on your website.
Don’t forget to respond to reviews, both positive and negative. Thanking customers for positive feedback shows appreciation, while addressing negative feedback demonstrates your commitment to improving customer satisfaction.
Imagine a customer named Jane who bought a pair of shoes from your store. She leaves a glowing review, praising the comfort and style. This review not only makes you feel good but also helps potential customers trust your brand. On the flip side, if John leaves a review mentioning a sizing issue, you can reach out, offer a solution, and turn a potentially negative experience into a positive one.
By keeping an eye on these customer satisfaction metrics, you can ensure your online store is not just meeting but exceeding customer expectations. After all, happy customers are the best brand ambassadors!
Analyzing And Adjusting Kpis
Analyzing and adjusting Key Performance Indicators (KPIs) is crucial for online stores. KPIs help you understand your store’s performance. By analyzing KPIs, you can identify areas that need improvement. Adjusting these KPIs ensures your store stays on track.
Setting Kpi Targets
First, set clear targets for each KPI. These targets should align with your business goals. For example, if you want to increase sales, set a target for conversion rates. Make sure your targets are realistic. Unrealistic targets can lead to frustration.
Regular Kpi Review
Review your KPIs regularly. Set a schedule for these reviews. Weekly or monthly reviews work best for most stores. Regular reviews help you spot trends early. They also allow you to make timely adjustments.
During each review, compare current performance to your targets. Look for any significant changes in the data. Identify what is working well and what is not. This will guide your adjustments.
Credit: www.qlik.com
Tools For Tracking Kpis
Understanding how your online store is performing is crucial for success. One way to measure this is by tracking Key Performance Indicators (KPIs). KPIs help you see what is working and what needs improvement. But how do you track these KPIs effectively? Let’s dive into some tools that can help you keep an eye on your KPIs for online stores.
Analytics Platforms
Analytics platforms are powerful tools that provide insights into how your store is performing. They collect data on customer behavior, sales, and website traffic. Here are some popular analytics platforms:
- Google Analytics: This is a free tool that offers a wealth of information about your website traffic and user behavior. You can track metrics like page views, bounce rates, and conversion rates.
- Shopify Analytics: If you are using Shopify, their built-in analytics provide detailed reports on sales, customer insights, and marketing performance.
- Kissmetrics: This platform focuses on customer interaction, helping you understand how visitors behave on your site and what drives conversions.
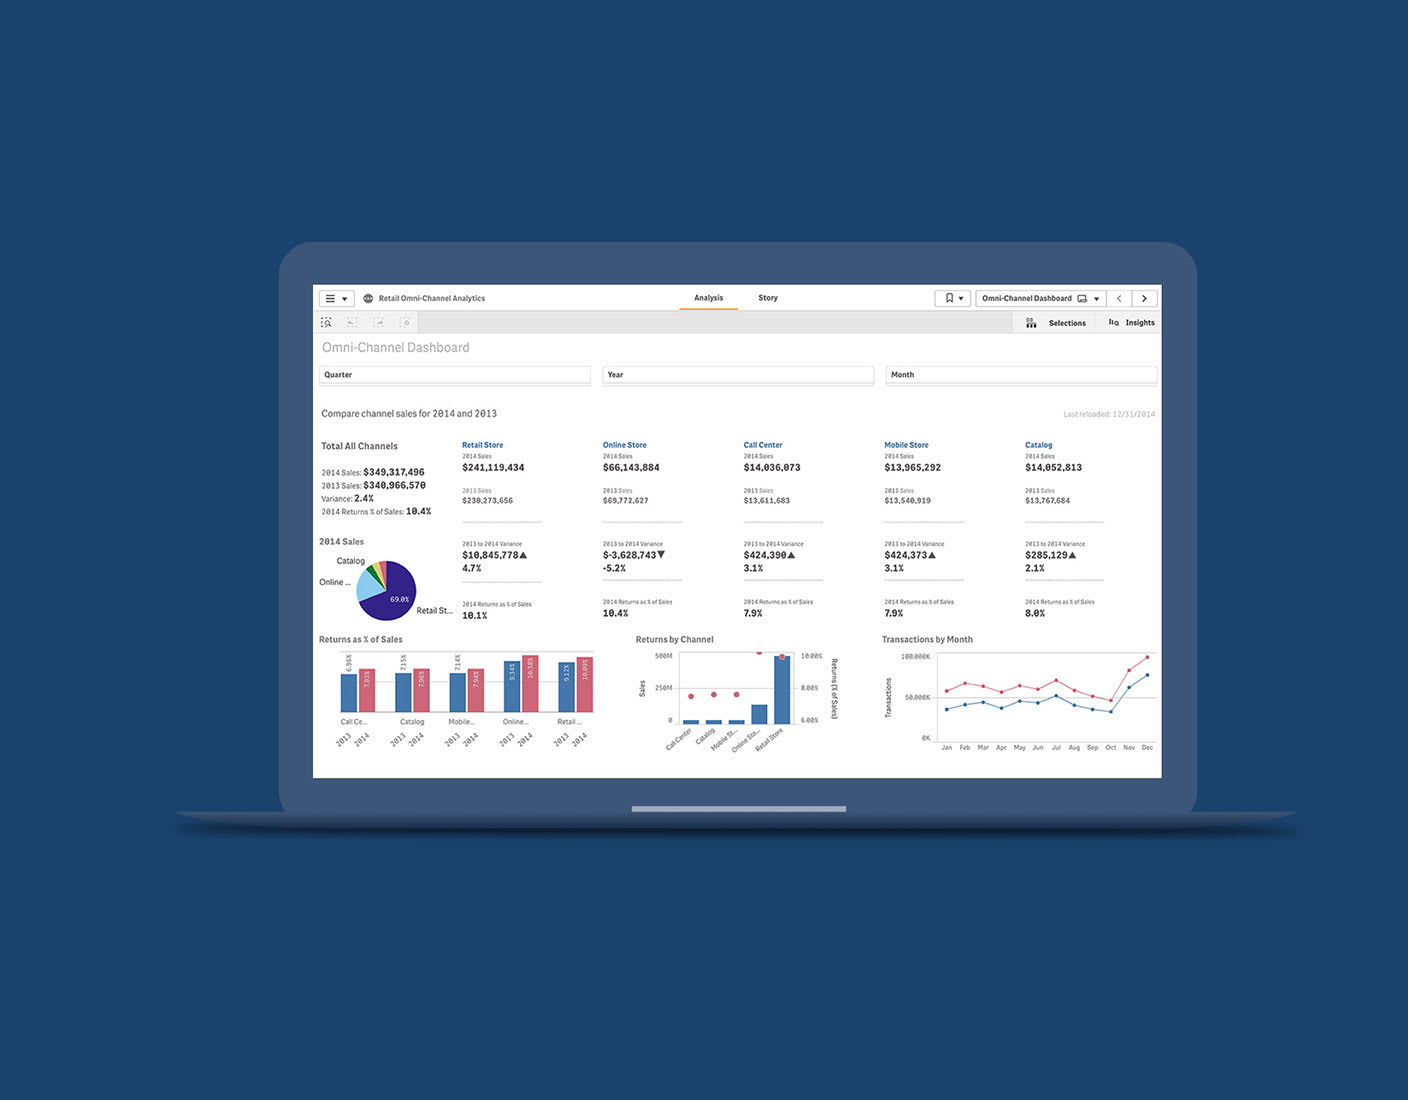
These platforms are essential for understanding the overall health of your online store. They offer dashboards that show real-time data, helping you make informed decisions quickly.
Custom Dashboards
While analytics platforms are great, sometimes you need something more tailored to your needs. This is where custom dashboards come in. A custom dashboard allows you to track the KPIs that matter most to you, all in one place.
Here are a few ways to create custom dashboards:
- Google Data Studio: This free tool lets you create interactive dashboards using data from Google Analytics, Google Ads, and other sources. You can customize the look and feel to match your brand.
- Excel or Google Sheets: For a more manual approach, you can use spreadsheets to track your KPIs. With the right formulas and charts, you can create a comprehensive dashboard.
- Third-Party Tools: Tools like Klipfolio or Geckoboard offer pre-built templates and integrations with various data sources, making it easier to set up a custom dashboard.
Creating a custom dashboard might take a bit more time upfront, but it pays off by giving you a clear and focused view of your store’s performance.
By using analytics platforms and custom dashboards, you can keep a close eye on your KPIs and ensure your online store stays on the path to success. Remember, the right tools can make all the difference!
Frequently Asked Questions
What Are Key Metrics In Ecommerce?
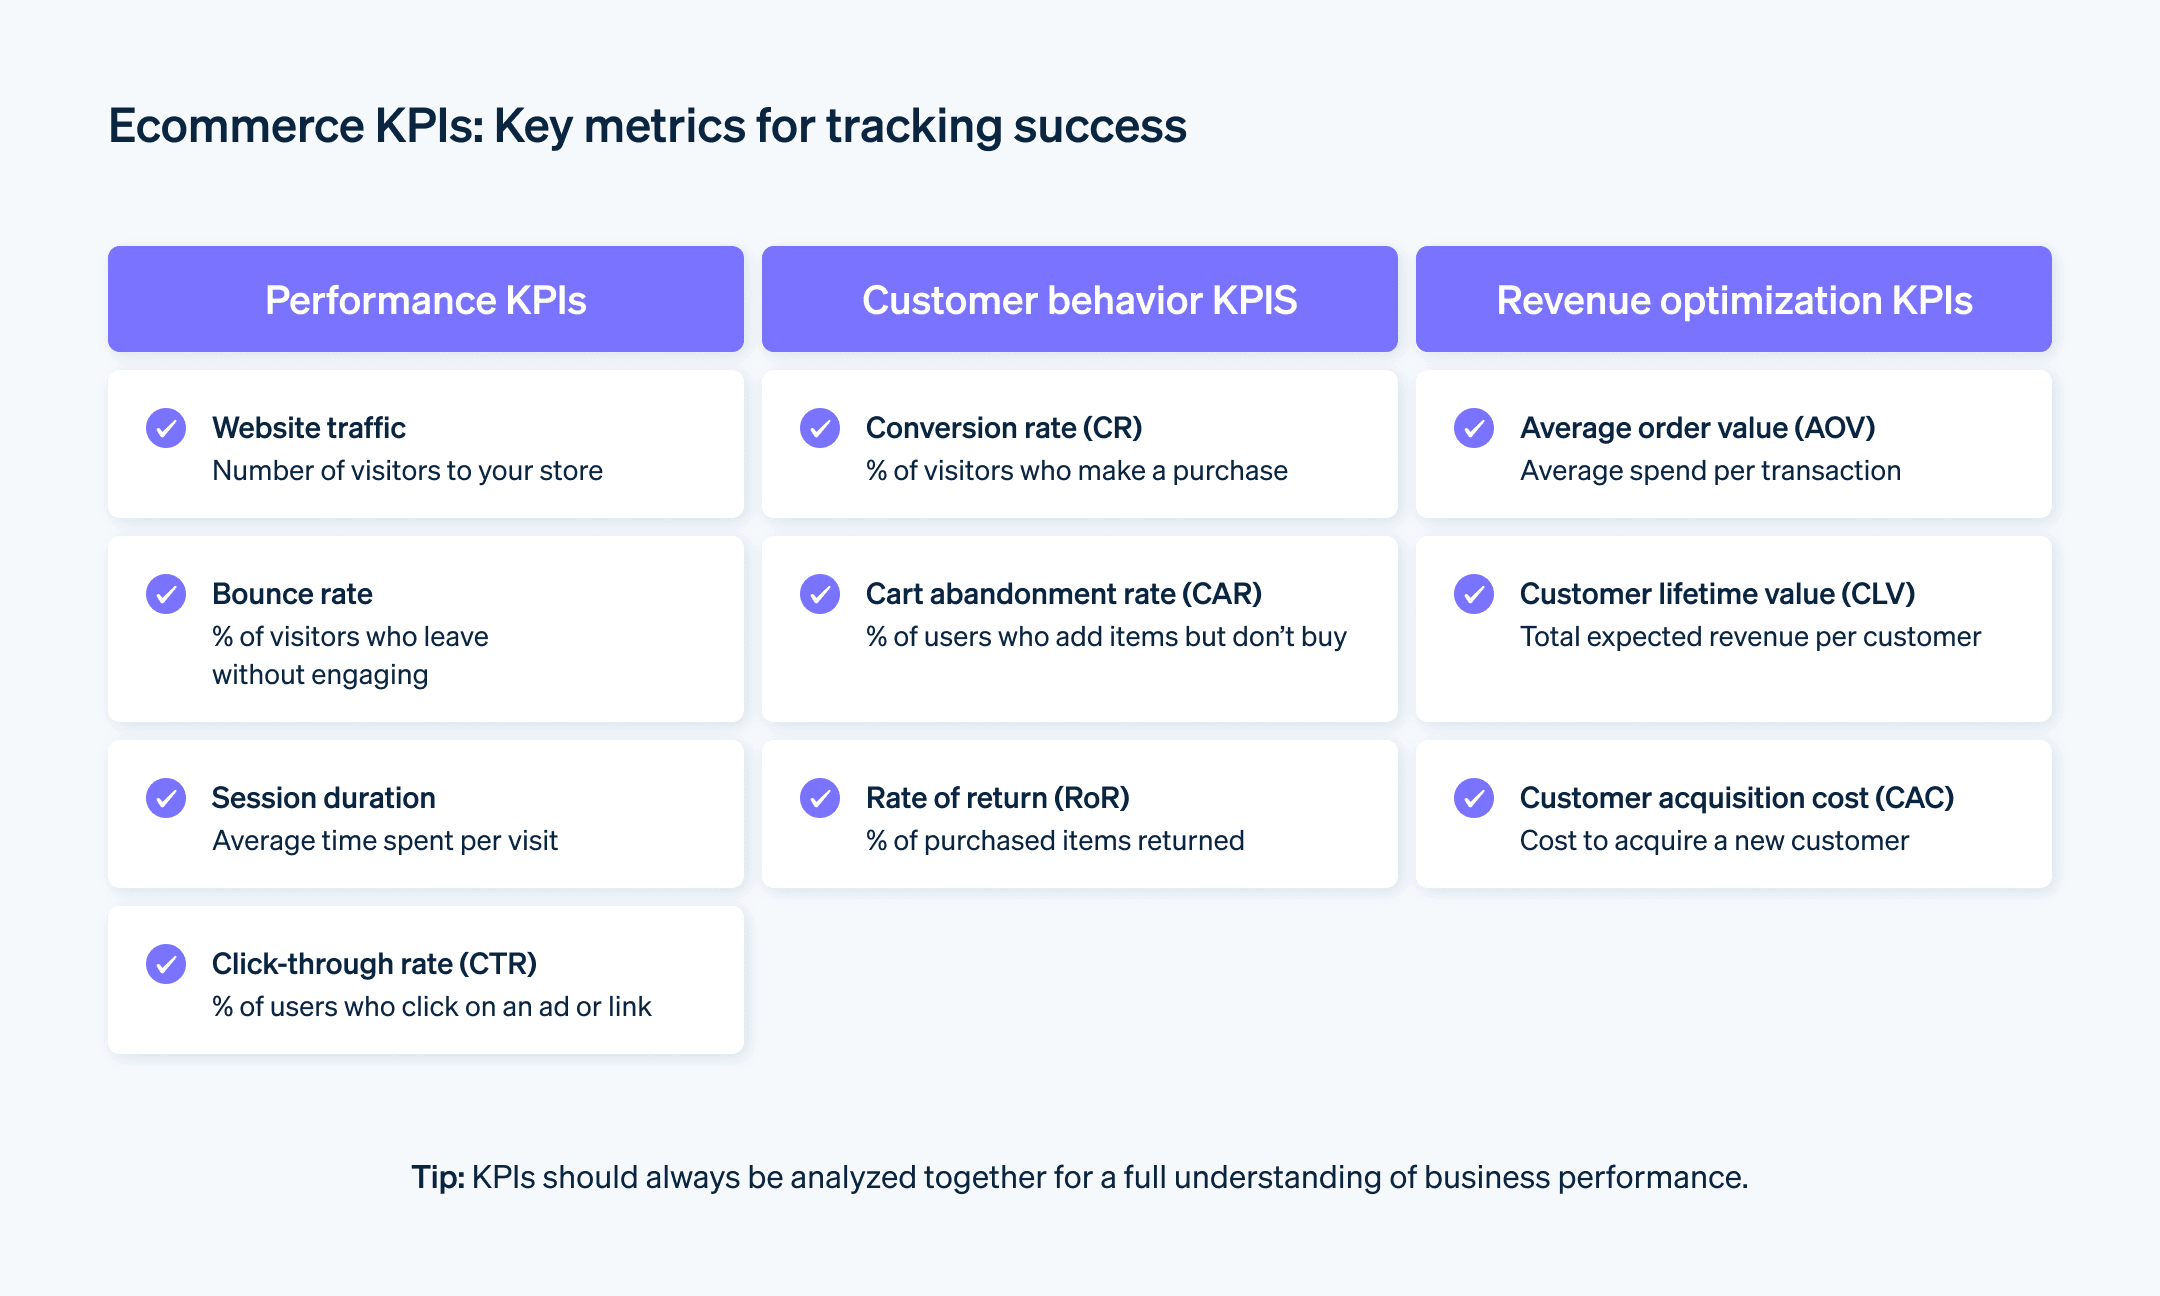
Key ecommerce metrics include conversion rate, average order value, customer lifetime value, cart abandonment rate, and website traffic.
Which Key Performance Indicators (kpis) Would You Prioritize To Evaluate The Success Of An E-commerce Advertising Campaign?
Prioritize these KPIs for evaluating e-commerce ad campaign success: conversion rate, click-through rate (CTR), return on ad spend (ROAS), customer acquisition cost (CAC), and average order value (AOV). These metrics provide insights into campaign effectiveness, customer engagement, and profitability.
What Are The 5 Key Performance Indicators For Customer Service?
The 5 key performance indicators for customer service are: 1. First Response Time 2. Customer Satisfaction Score (CSAT) 3. Net Promoter Score (NPS) 4. Resolution Time 5. Customer Retention Rate
How Do You Know If Your E-commerce Online Store Is Successful?
Track metrics like sales growth, customer retention, average order value, and website traffic. Positive trends indicate success.
Conclusion
Effective KPIs help online stores succeed. Track sales, customer retention, and website traffic. Monitor cart abandonment rates and average order value. Use data to improve strategies. Regularly review and adjust KPIs. Stay focused on your goals. Evaluate performance to boost growth.
Measure the right metrics for success. Online stores thrive with clear, relevant KPIs.