
Understanding user behavior is key for e-commerce success. Heatmaps offer a visual way to see this behavior.
In the competitive world of e-commerce, user experience (UX) can make or break your business. Heatmaps provide valuable insights into how visitors interact with your website. By showing where users click, scroll, and hover, heatmaps reveal patterns that can improve your site’s design and functionality.
These patterns help you identify areas that need attention, ensuring a smoother and more engaging shopping experience. Whether you’re looking to boost conversions or reduce bounce rates, using heatmaps can guide you in making data-driven decisions. Dive into the world of heatmaps and discover how they can enhance your e-commerce UX for better results.
Introduction To Heatmaps
Understanding user behavior is crucial for e-commerce success. One of the best tools to achieve this is a heatmap. Heatmaps provide a visual representation of data. They show how visitors interact with your website. This can help you make informed decisions to improve user experience (UX).
What Are Heatmaps?
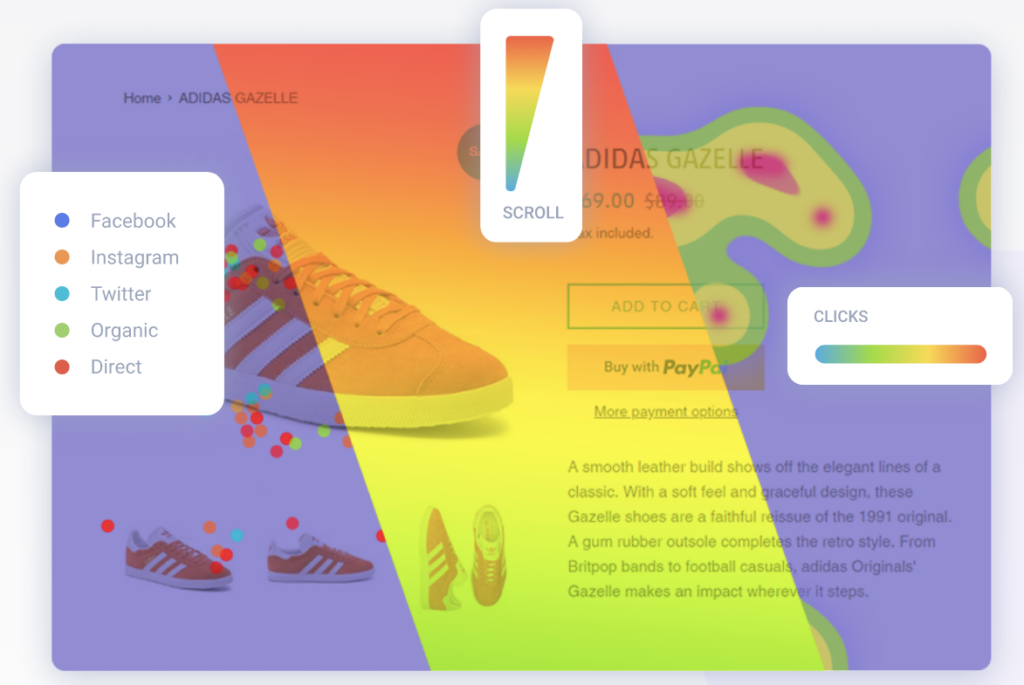
Heatmaps are graphical representations of data. They use colors to show the most and least popular areas on a webpage. Hot colors like red and yellow indicate high activity. Cool colors like blue and green indicate lower activity.
These maps help you see where users click, scroll, or hover their mouse. This visual data can help you understand user behavior on your site.
Importance In E-commerce Ux
In e-commerce, user experience is key to converting visitors into customers. Heatmaps can highlight areas that need improvement. They show where users struggle or get confused.
This data helps you optimize your site layout, call-to-action buttons, and product placements. You can make changes based on actual user behavior. This leads to a smoother shopping experience and higher conversion rates.
By understanding these interactions, you can create a more intuitive and user-friendly website. This keeps customers happy and coming back for more.

Credit: capturly.com
Types Of Heatmaps
Understanding the different types of heatmaps is crucial for optimizing your e-commerce UX. Heatmaps provide visual data that shows how users interact with your website. There are three main types: click heatmaps, scroll heatmaps, and move heatmaps. Each type offers unique insights that can help improve your site’s usability and conversion rates.
Click Heatmaps
Click heatmaps show where users click on a webpage. This helps you see which elements get the most attention. For example, you can find out if users are clicking on buttons or if they miss important links. These insights can help you rearrange elements to make the site more user-friendly.
Scroll Heatmaps
Scroll heatmaps reveal how far down a page users scroll. This data shows if users are seeing your important content. If they don’t scroll far, you may need to move key information higher. Understanding scrolling behavior helps you keep users engaged.
Move Heatmaps
Move heatmaps track where users move their mouse. This type of heatmap can indicate which areas users find interesting. By analyzing mouse movements, you can get a sense of what catches users’ eyes before they click. These insights can help you optimize the layout for better user interaction.
Setting Up Heatmaps
Setting up heatmaps can greatly improve your e-commerce UX. With heatmaps, you can see where users click, scroll, and hover. This valuable data helps you understand user behavior on your site. It allows you to make informed decisions to enhance the user experience.
Choosing The Right Tool
First, select the right heatmap tool. There are many options available. Some popular choices include Hotjar, Crazy Egg, and Mouseflow. Consider the features each tool offers. Look for tools that provide click maps, scroll maps, and hover maps. Also, check if they offer easy integration with your site.
Implementing On Your Site
After choosing a tool, implement it on your site. Most tools provide a tracking code. You need to add this code to your website’s header. This code will start collecting data for your heatmaps. Follow the tool’s instructions carefully. This ensures the heatmap works correctly.
Once the code is in place, let it run for a week. This duration allows the heatmap to gather enough data. You will then have a clearer picture of user behavior. Regularly check the data to identify patterns and areas for improvement.
Credit: fastercapital.com
Analyzing Heatmap Data
Analyzing heatmap data is crucial for optimizing e-commerce user experience (UX). Heatmaps visually represent user interactions on your site. They show where users click, scroll, and hover. By analyzing this data, you can gain insights into user behavior and spot UX issues. This can help you make data-driven decisions to enhance your site’s performance.
Identifying User Behavior
Heatmaps reveal how users interact with your website. Click heatmaps show the most clicked areas. This helps in understanding which elements attract attention. Scroll heatmaps indicate how far users scroll down a page. You can see if important content is being missed. Hover heatmaps show where users pause their cursor. This can highlight points of interest or confusion.
Spotting Ux Issues
Heatmaps can pinpoint UX problems. If users frequently click on non-clickable elements, it indicates confusion. This suggests a need for better design or clearer instructions. Scroll heatmaps can show if users abandon a page before reaching key content. This might mean the page is too long or not engaging enough.
Hover heatmaps can reveal areas where users hesitate. This might indicate unclear navigation or confusing information. By spotting these issues, you can make targeted improvements. This leads to a smoother and more enjoyable user experience.
Optimizing Product Pages
One of the key areas to focus on when using heatmaps for e-commerce UX optimization is product pages. These pages are where customers make their buying decisions, so getting them right is crucial. Let’s dive into how you can improve your product layout and enhance your call-to-actions to boost conversions and overall user experience.
Improving Product Layout
Product layout is the backbone of your product page. A good layout can guide the user’s eye and make the shopping experience seamless. Heatmaps can show you where users are clicking, moving their mouse, and spending most of their time. This data is gold for understanding what works and what doesn’t.
Here are a few tips to improve your product layout:
- Images: Ensure high-quality images are front and center. Users tend to focus on visual elements first.
- Descriptions: Keep product descriptions short but informative. Bullet points work great here.
- Price Visibility: Make sure the price is easy to find. Users shouldn’t have to hunt for this information.
Enhancing Call-to-actions
Call-to-actions (CTAs) are the buttons or links that prompt users to take action, like “Add to Cart” or “Buy Now.” Heatmaps can show you if these CTAs are being noticed and clicked on. If not, it might be time for a tweak.
Here are some tips to enhance your CTAs:
- Positioning: Place CTAs where they are easily visible, typically above the fold.
- Color and Size: Use contrasting colors and make the buttons large enough to stand out.
- Wording: Use clear and compelling language. “Buy Now” is often more effective than “Submit.”
Remember, even small changes can make a big difference. By using heatmaps to understand user behavior, you can fine-tune these elements and create a more effective product page.
Enhancing Checkout Process
When it comes to running a successful e-commerce business, the checkout process can make or break your sales. If your customers find the checkout confusing or too lengthy, they might abandon their cart and leave your site frustrated. That’s where heatmaps come into play. By using heatmaps, you can visualize how users interact with your site, helping you identify and fix issues within the checkout process. Let’s dive into some key areas where heatmaps can make a significant impact.
Simplifying Navigation
Think of your website as a store. If customers can’t find their way to the checkout, they’re likely to leave empty-handed. Heatmaps show you where users click, allowing you to see if they’re struggling to navigate your site. If you notice that users are frequently clicking around without progressing, it might be time to simplify your navigation.
- Reduce clutter: Remove unnecessary links and buttons that may confuse users.
- Highlight important buttons: Make the ‘Checkout’ button more prominent to guide users smoothly to the payment stage.
- Streamline menus: Use clear, concise menu labels to help users find what they need quickly.
Reducing Cart Abandonment
Cart abandonment is a common issue in e-commerce. Customers add items to their cart but leave before completing the purchase. This can be disheartening, but heatmaps provide valuable insights into why this happens. By analyzing heatmap data, you can identify drop-off points during the checkout process and take steps to improve them.
- Simplify forms: Long forms can be intimidating. Keep fields to a minimum and only ask for essential information.
- Offer guest checkout: Not everyone wants to create an account. Provide a guest checkout option to speed up the process.
- Display progress indicators: Let users know how close they are to completing their purchase with a clear progress bar.
In conclusion, using heatmaps to optimize your e-commerce UX can lead to a smoother checkout process, ultimately boosting your sales and reducing cart abandonment rates. Start leveraging the power of heatmaps today and watch your conversion rates soar!
Boosting User Engagement
Using heatmaps can greatly improve user engagement on your e-commerce site. Heatmaps show where users click, scroll, and spend most of their time. This data helps optimize content placement and interactive elements. With better user engagement, your site can convert more visitors into customers.
Optimizing Content Placement
Content placement is crucial for user engagement. Heatmaps reveal which areas get the most attention. Place key content in these hot spots. Move less important items to less active areas. This ensures users see what matters most. Keep content easy to find and relevant.
Evaluate and adjust content placement regularly. User behavior can change over time. Stay updated with heatmap data. Test different layouts to see what works best. Always aim for a user-friendly experience.
Enhancing Interactive Elements
Interactive elements can boost engagement significantly. Heatmaps help identify which elements users interact with most. Buttons, forms, and links should be in high-traffic areas. Ensure these elements are easy to spot and use.
Improve underperforming elements based on heatmap data. Make buttons more visible. Simplify forms. Enhance links with clear, concise text. Engaging interactive elements make the user experience smoother.
Test changes and monitor the results. Use heatmaps to see if user interaction improves. Keep tweaking until you get the best results. Engaged users are more likely to convert into loyal customers.
Measuring Success
When it comes to optimizing your e-commerce user experience (UX), measuring success is key. It’s not just about making changes and hoping for the best. You need concrete data to know if your strategies are working. This is where heatmaps come into play. They provide visual insights into how users interact with your site, allowing you to track performance metrics and adjust strategies accordingly.
Tracking Performance Metrics
To understand how well your e-commerce site is performing, you need to track specific metrics. Heatmaps can help you do this by showing you where users click, how far they scroll, and which parts of your site they ignore. By analyzing this data, you can identify areas that need improvement.
- Click Maps: Show where users click the most. This helps you understand which buttons or links are popular and which ones are being ignored.
- Scroll Maps: Indicate how far down the page users scroll. If users aren’t scrolling to the bottom, important information might be missed.
- Move Maps: Track mouse movements. This can give you insights into how users navigate your site.
Let’s say you notice that users are clicking a lot on a specific product category. This could indicate a high level of interest, suggesting you should feature this category more prominently on your homepage.
Adjusting Strategies
Once you have gathered data from heatmaps, it’s time to adjust your strategies. This doesn’t mean overhauling your entire site, but rather making targeted changes based on user behavior.
- Identifying Pain Points: If heatmaps show that users are frequently clicking on non-clickable elements, it might indicate confusion. You can address this by making these elements clickable or providing clearer navigation cues.
- Enhancing User Flow: If scroll maps reveal that users are not reaching the bottom of your product pages, consider moving important content higher up.
- Optimizing Calls to Action (CTAs): Click maps can show whether your CTAs are effective. If a CTA button is not getting enough clicks, try changing its position, color, or wording.
For example, if a particular product page has a high exit rate, you might reconsider the design or content of that page. Small tweaks, like changing the product description or adding customer reviews, can make a big difference.
By leveraging heatmaps to track performance metrics and adjust strategies, you can continuously improve your e-commerce UX. Remember, the goal is to create a seamless and enjoyable shopping experience for your users. And who knows? With a little bit of effort, you might just turn those casual browsers into loyal customers.
Case Studies
Case studies provide real-world examples of how businesses use heatmaps. They offer insights into successful strategies and common pitfalls. These stories illustrate the power of heatmaps in optimizing e-commerce UX.
Successful Implementations
One e-commerce store used heatmaps to track user behavior. They found that users often ignored the sidebar. By removing it, they simplified the layout. This change increased conversion rates by 20%.
Another store noticed users struggled with the checkout process. The heatmap showed a high dropout rate at the payment stage. They redesigned the payment page, making it more intuitive. The result was a 15% increase in completed purchases.
Lessons Learned
Heatmaps reveal where users click, scroll, and hover. This data helps businesses understand user preferences. One common lesson is the importance of a clear call-to-action. If users can’t find it, they won’t convert.
Another lesson is the value of simplifying navigation. Complex menus can confuse users. Heatmaps can show which sections of the site users engage with most. Simplifying the menu based on this data can improve user experience.
Lastly, heatmaps highlight issues with mobile usability. Many users shop on mobile devices. Ensuring the site is mobile-friendly is crucial. Heatmaps can help identify areas where mobile users struggle.
Credit: capturly.com
Future Of Heatmaps In E-commerce
The future of heatmaps in e-commerce looks promising. As online shopping grows, understanding user behavior becomes key. Heatmaps offer insight into how users interact with your site. They show where visitors click, scroll, and focus. This data helps improve user experience (UX). Staying ahead means keeping up with new trends and technology. Let’s explore what the future holds.
Emerging Trends
Personalized heatmaps are on the rise. They provide data tailored to individual user journeys. This helps create unique shopping experiences. Another trend is integrating heatmaps with other analytics tools. Combining data sources gives a fuller picture. It helps in making better decisions. AI-driven heatmaps are also becoming popular. They analyze user behavior and predict future actions. This helps in optimizing site design and content.
Technological Advancements
Technology is evolving fast. Heatmap tools are becoming more advanced. Real-time heatmaps are now available. They provide instant feedback on user interactions. This helps in making quick changes. Heatmaps now also support mobile and tablet views. This is crucial as more people shop on their phones. Some tools use eye-tracking technology. They show exactly where users look on the page. This gives deeper insight into user behavior. Heatmaps are also integrating with machine learning. This allows for smarter analysis and better UX improvements.
Frequently Asked Questions
What Are Heatmaps In E-commerce Ux?
Heatmaps are visual tools that display user interaction data on a webpage. They highlight where users click, scroll, and hover. This helps identify popular and ignored areas.
How Do Heatmaps Help Improve Ux?
Heatmaps reveal user behavior patterns on your site. This insight helps optimize layout, content placement, and navigation. Improved UX leads to higher engagement and conversion rates.
What Types Of Heatmaps Are Used In E-commerce?
Common types include click maps, scroll maps, and hover maps. Click maps show click areas, scroll maps display scrolling behavior, and hover maps indicate mouse movement.
Can Heatmaps Increase Conversion Rates?
Yes, heatmaps help identify UX issues and optimize your site. By improving user experience, you can boost customer satisfaction and conversion rates.
Conclusion
Heatmaps are essential tools for improving e-commerce UX. They show user behavior clearly. By analyzing heatmaps, you can find problem areas quickly. This helps in making smart design changes. Better UX leads to happier customers and higher sales. So, start using heatmaps today.
They are simple yet powerful. Your e-commerce site deserves the best user experience.